

What Is Customer Acquisition Cost (and Why Is Yours Probably Wrong)?
Customer acquisition cost (CAC) is the total amount a business spends on sales and marketing to acquire one new customer. It is calculated by dividing total sales and marketing spend over a period by the number of new customers won in that same period.
That definition takes two sentences. Computing the number is where companies lose money.
In 14 years inside ad accounts, I have rarely seen two companies calculate CAC the same way. Most dashboards hold a version of the number that would not survive a finance review.
Both directions of that error cost real money. A CAC that reads better than reality keeps a broken funnel funded for another quarter. A CAC that reads worse than reality kills campaigns that were quietly profitable.
This guide is the practitioner's version. The formula and a working calculator, what actually belongs inside the number, why the measured version is usually wrong before the marketing is, and what a good CAC means once lifetime value enters the room.
What does CAC stand for?
CAC stands for customer acquisition cost. In marketing, CAC is the standard measure of what it costs to turn a stranger into a paying customer, and it sits at the center of every serious conversation about whether growth is working.
You will see CAC used interchangeably with CPA, cost per acquisition. They are related and different. CPA usually prices a conversion event. A lead, a trial signup, an app install. CAC prices a new paying customer, full stop.
The distinction has teeth. Plenty of teams celebrate a healthy CPA on leads while the cost of an actual paying customer, three funnel steps later, quietly doubles.
The acronym hides one more problem. "Cost" has at least three working definitions, and the one you pick can move the number by multiples for the same month. That question gets its own section below, because it decides more than most teams realize.
How do you calculate customer acquisition cost?
The customer acquisition cost formula is one line.
CAC = Total sales and marketing spend ÷ New customers acquired (same period)
A worked example. Say a business spent 60,000 dollars on sales and marketing last quarter. Ads, salaries, agency fees, tools. In the same quarter it signed 120 new customers.
60,000 ÷ 120 = 500 dollars per new customer. That is CAC.
Two rules keep the formula honest.
Match the period. March spend divided by January customers tells you nothing. Long sales cycles blur this, and the workable fix is consistency. The same window for spend and customers, every single report. If your cycle runs 90 days, a quarterly window will behave better than a monthly one.
Count new customers only. Returning buyers in the denominator flatter the number immediately. If the report says "purchases" where it should say "first purchases", the CAC inside it is already wrong.
Run your own numbers in the CAC calculator. It computes the basic version and, if you add lifetime value, the ratio most investors will ask about.
The formula is the easy half. The argument starts with what goes into the top of it.
Which costs actually belong in your CAC?
A client asked us mid-engagement which definition of CAC we were even using.
The question was sharper than it sounds. We were reporting one version of the number, their finance team was computing another, and the two were never going to match. Nobody had agreed on the definition out loud.
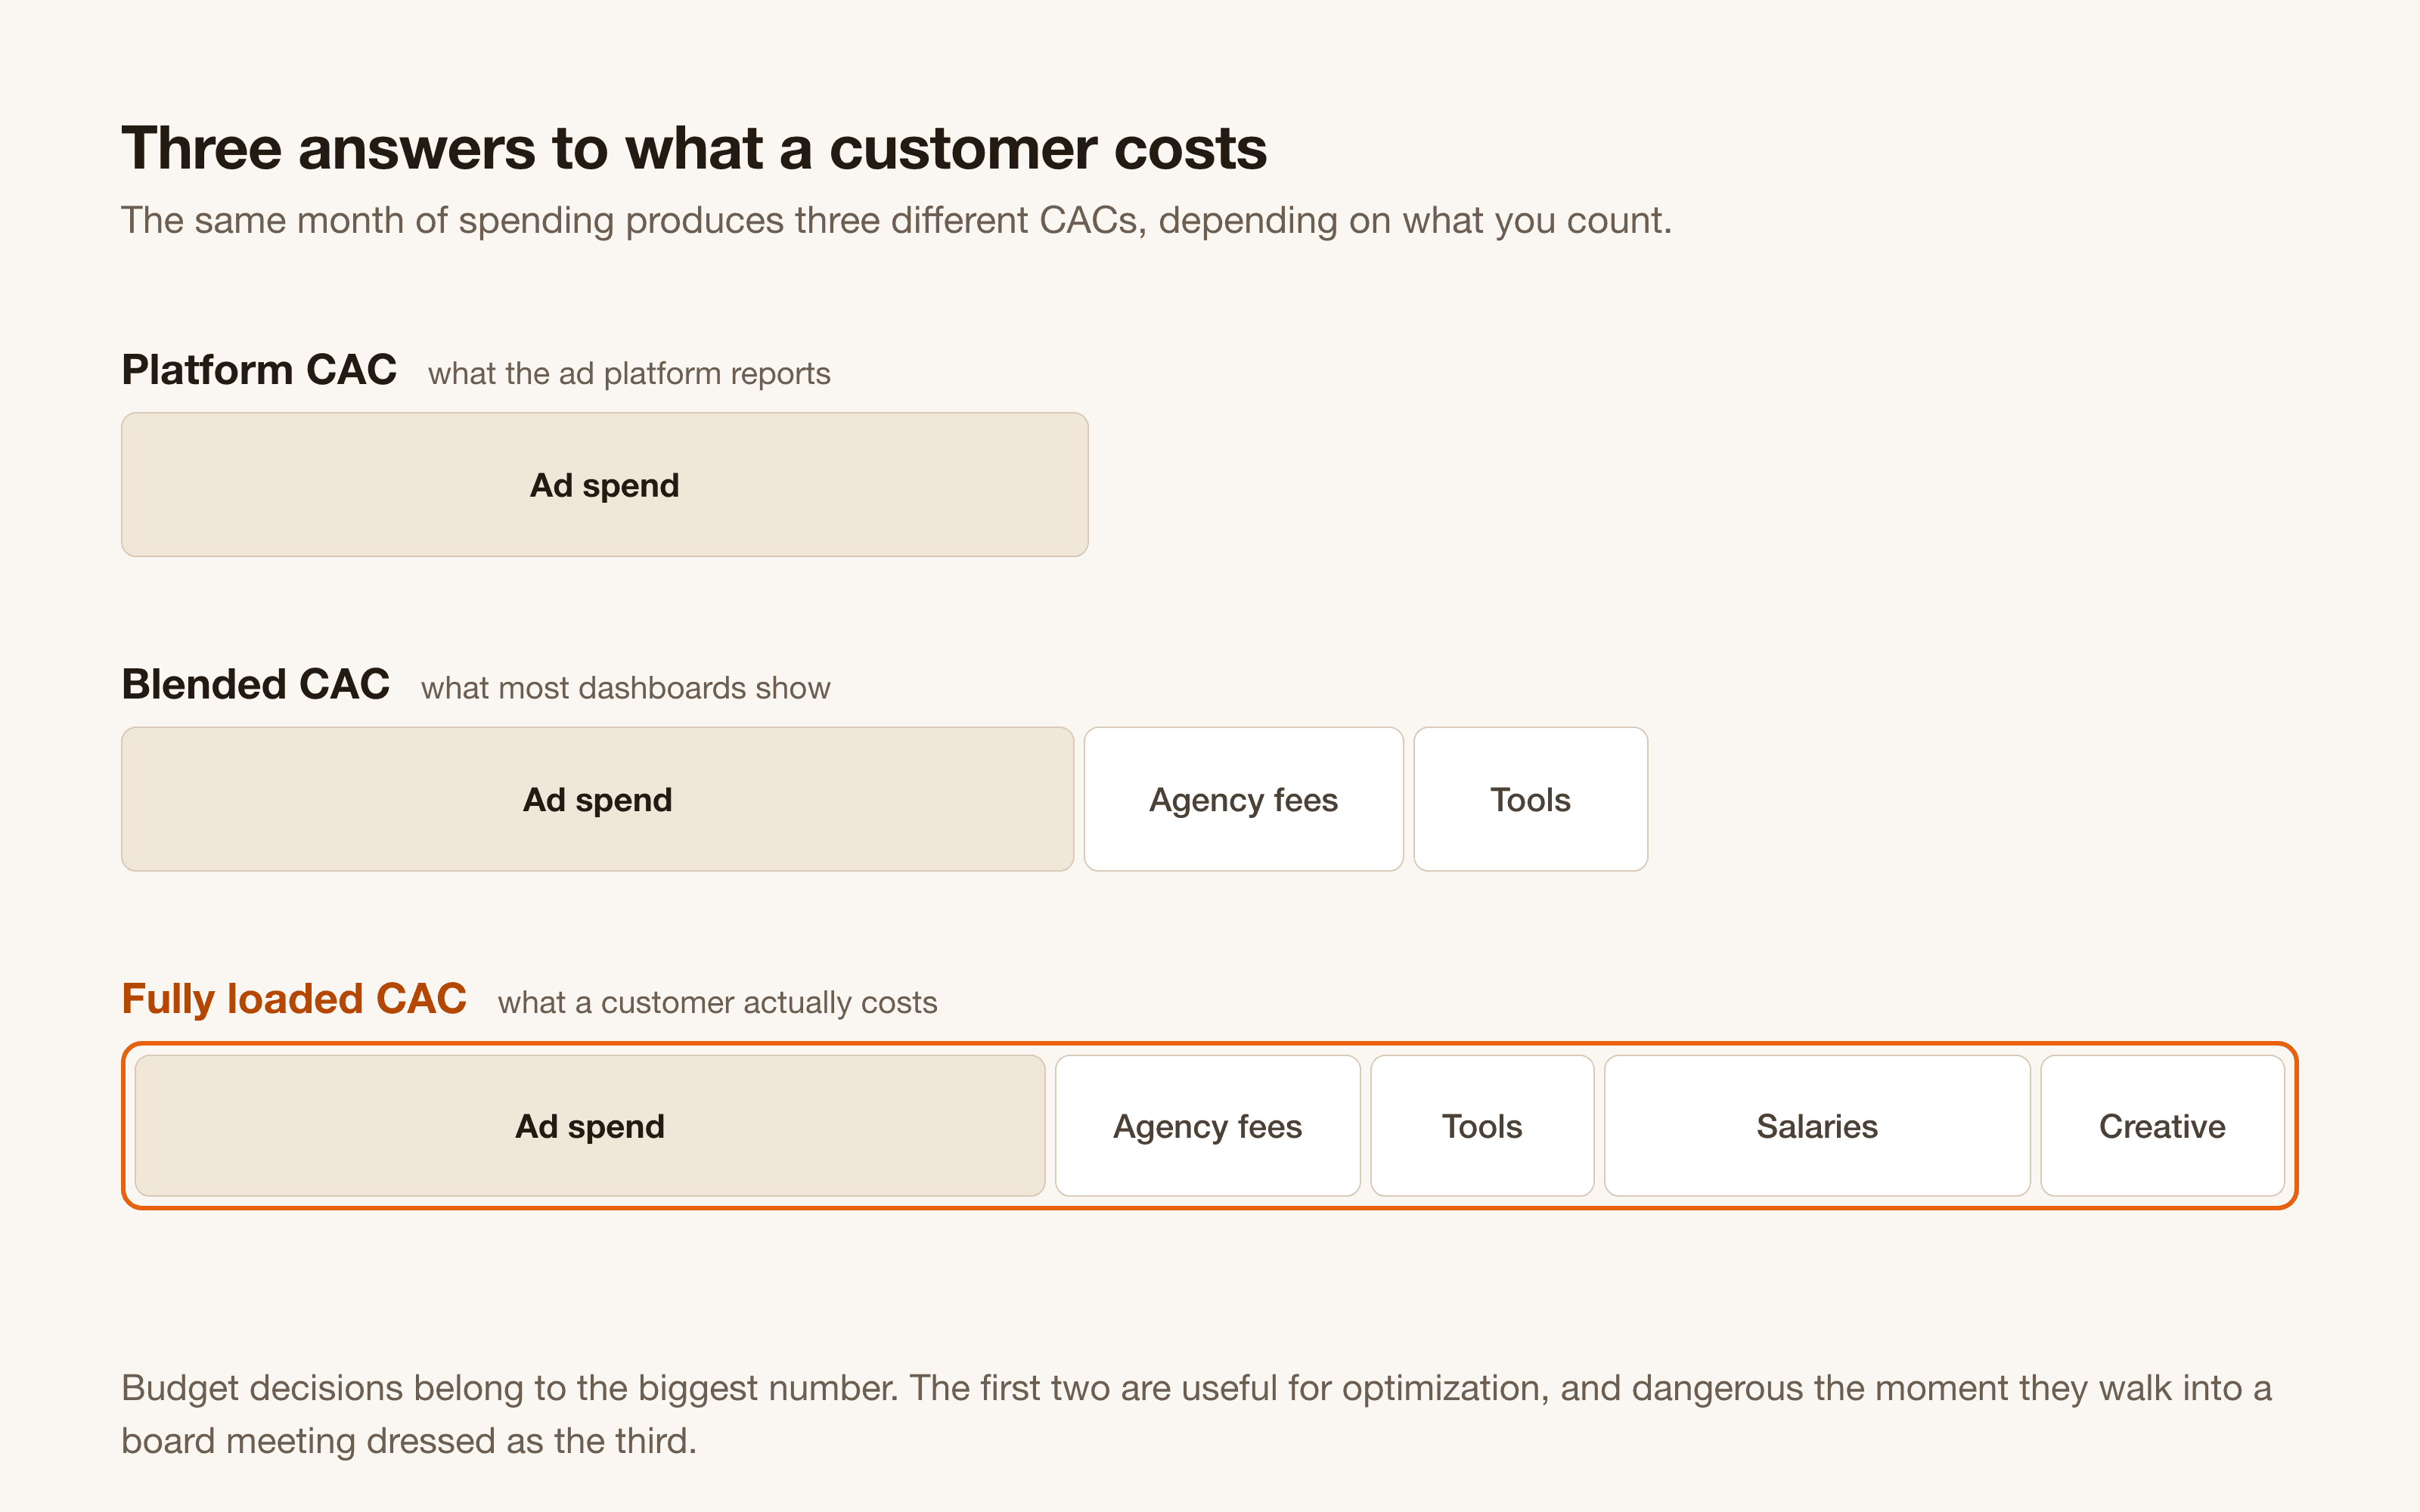
There are three honest definitions, and each answers a different question.
Platform CAC. One platform's ad spend divided by the customers that platform claims. Useful for optimization decisions inside the platform. Also the most flattering version, because platforms count conversions generously and the spend excludes everyone you pay outside the auction.
Blended CAC. All paid media across channels, divided by all new customers from every source, organic included. Useful for watching the whole acquisition engine trend over time. It also hides sins. A weak paid program can shelter inside a blended number for months, because organic customers subsidize the average.
Fully loaded CAC. Everything the acquisition motion costs. Media, agency and freelancer fees, salaries of the people running growth and sales, tools, creative production, commissions. Divided by new customers. This is the version your CFO means, and the version any serious investor will rebuild from your books whether you report it or not.
Take a simplified month. Ad spend alone puts platform CAC at 200 dollars. Spread every channel's media over all new customers and blended CAC lands at 350. Add the team, the agency, and the stack, and fully loaded CAC reaches 500.
Same company. Same month. Three defensible numbers, and a 2.5x spread between the version marketing quotes and the version finance pays.
Definition | What it includes | What it is for |
|---|---|---|
Platform CAC | One platform's ad spend, that platform's claimed customers | Optimization inside the platform |
Blended CAC | All media spend, all new customers | Channel mix, trend lines |
Fully loaded CAC | Media plus salaries, fees, tools, production | Unit economics, pricing, board reporting |
All three are legitimate. The damage starts when teams use them interchangeably, or when each team quietly picks the version that makes its own work look best.
Choose deliberately. Label every report with the definition it uses. And never let a platform CAC from one quarter get compared against a fully loaded CAC from another.
Why is your CAC probably measured wrong?
Before the definitions even matter, there is a quieter problem. The inputs feeding every version of CAC are usually wrong.
Start with the customer count. Ad platforms attribute generously by default. Meta's standard settings will claim a customer who viewed an ad without clicking and bought within a day. We once audited a retail account that Meta's own reporting valued at 1.4x and at 29x for the same period, depending on which attribution rules were applied. Analytics put the same account at roughly 1.5x. The full mechanics are in our guide to how Facebook conversion tracking works.
Over-claimed conversions deflate platform CAC on paper while nothing changes in the bank account. The same distortion shows up on the other side of the duopoly, where Google Ads conversions can climb while revenue falls because the definition of a conversion drifted inside the account and nobody caught it.
Analytics tools carry the opposite bias. Ad blockers, consent banners, and browser privacy restrictions stop a real slice of conversions from ever being recorded. GA4 will almost always credit your paid channels with fewer customers than they produced, so a CAC computed on GA4 numbers runs high while the platform version runs low.
Attribution windows add a third distortion. A customer who clicks in March and buys in April lands in whichever month the tooling prefers, and your CAC trend moves without performance changing at all.
The defense is layered measurement. Platform numbers for relative calls inside the platform, which creative and which audience wins. Analytics for cross-channel comparison under one consistent set of rules. The CRM and the bank account as the truth layer for the CAC that reaches your board.
Then reconcile monthly. Customers the platforms claim versus customers the business actually gained. The gap between those two counts is itself a metric, and when it widens, something in the stack is drifting.
If the layers disagree wildly, fix measurement before touching the marketing. A team optimizing against a wrong CAC is optimizing in the wrong direction with full confidence.
What is a good CAC?
No benchmark table can answer this for you, and most of them will actively mislead you.
Search for average customer acquisition cost and you will find pages of industry tables, each quoting figures for SaaS, e-commerce, fintech, whatever you need. We do not publish one, for a reason those pages never disclose. A benchmark table almost never states which definition of CAC its numbers use.
An average built from platform CAC self-reports and an average built from fully loaded numbers can differ by multiples, and once they are blended into one column the figure describes nobody. Layer on the differences in price point, sales motion, geography, and margin between you and whoever answered the survey, and the benchmark stops being information.
A good CAC is the one your own economics can afford, and two numbers you already own decide that.
The first is customer lifetime value. The common convention says a healthy business holds an LTV to CAC ratio of about 3 to 1, three dollars of lifetime value for every dollar spent acquiring it. Treat that as a convention the industry finds useful, and nothing more. A business at 3 to 1 with a two-year payback can still starve for cash while a business at 2 to 1 that recovers its CAC on the first purchase compounds happily.
The second is payback period. The months of gross margin a new customer takes to return the CAC you paid for them. For a growing company this is usually the more decision-relevant number, because it determines whether growth consumes cash or throws it off.
So build the only benchmark that means anything. Your own CAC, by definition and by channel, trended monthly against your own LTV and payback. Three months of that view will answer questions no industry table ever could.
What is a good CAC for SaaS and B2B?
SaaS and B2B get their own section because subscription revenue and sales teams both change what CAC means.
A SaaS customer pays you back over months or years. So a SaaS CAC standing alone tells you almost nothing, and only starts to speak next to LTV and payback. The 3 to 1 convention grew up in the SaaS world for exactly this reason. The ratio math is the business model.
B2B customer acquisition cost adds a further twist. In most B2B companies the biggest acquisition cost is people. SDRs, account executives, solutions engineers, the founder's own selling time. A B2B team computing CAC from ad spend alone is reporting a fraction of the real figure, and usually the smallest fraction.
Three habits keep SaaS and B2B CAC honest.
Separate new-business CAC from expansion. Upsells and renewals into existing accounts cost far less than net-new logos, and mixing them flatters the number exactly where investors look hardest.
Use fully loaded CAC for anything that reaches the board. In B2B the sales team is the acquisition motion. Excluding its cost from CAC hides the real economics of every deal.
Track CAC by segment. Enterprise and self-serve customers acquired by the same company carry radically different CACs and LTVs. The blended average routinely hides one segment being bought at a loss, and finding that out early is the whole point of the exercise.
Why is your CAC rising, and what can you actually do about it?
When CAC rises, most companies look for one person. The media buyer gets the message. Fix it.
We wrote about this pattern on LinkedIn as the accountability gap. Performance marketers get blamed for 100 percent of CAC and control roughly half of what moves it.
The levers marketing controls.
Targeting, who sees the ads
Creative, what they see and whether it earns the click
Bidding and budget allocation, what attention costs and where the money goes
Measurement, what gets counted as a customer
What moves CAC anyway.
Product, whether people want the thing
Price and offer, whether the click has a reason to buy now
Landing page, whether the traffic converts
Sales follow-up, how fast and how well leads get worked
The market itself, competitors bidding the same auctions, seasonality, rising ad costs
CAC is not a media-buying number. It is a business number wearing a media-buying costume.
That split also dictates how to reduce customer acquisition cost, in order.
First, fix measurement. If the number is wrong, every optimization against it is noise. In our audits this is the most common finding and the cheapest CAC reduction available, because it costs an engineering sprint rather than a media budget.
Second, work the levers marketing owns. A real creative testing cadence in place of an occasional refresh. Budget moved toward the channels and segments with the best fully loaded CAC rather than the prettiest platform CAC. Exclusions that stop you paying to re-acquire customers you already have.
Third, put the shared levers on the table with the people who own them. A pricing test. A stronger offer. A landing page rebuilt around the ad's promise. Lead follow-up measured in minutes rather than days. In our experience the biggest CAC reductions come from this third list, and no media buyer can deliver them alone.
If CAC is rising and the response so far has been pressure on the ad account, the diagnosis is the accountability gap. Widen the conversation before you narrow the targeting.
Frequently asked questions
How is CAC calculated?
Divide total sales and marketing spend in a period by the number of new customers acquired in the same period. Spend 60,000 dollars in a quarter, sign 120 new customers, and CAC is 500 dollars. The result depends heavily on what you count as spend. Ad spend alone gives platform CAC, all channels give blended CAC, and adding salaries, fees, and tools gives fully loaded CAC. State which version you are using every time you report it. The CAC calculator runs the media-only and fully loaded versions for you.
What is a good CAC percentage?
CAC is a currency amount rather than a percentage, so this question usually means CAC as a share of customer lifetime value. The common convention is an LTV to CAC ratio of about 3 to 1, which implies a CAC around one third of lifetime value. Treat it as a rule of thumb rather than a target every business must hit. Payback period, the months of gross margin needed to recover CAC, is often the more useful test for a growing company.
What is a reasonable customer acquisition cost?
A reasonable CAC is one your own economics can support. It should sit comfortably below the lifetime value of the customer it buys, and your gross margin should pay it back within a window your cash position can fund. A 500 dollar CAC is excellent for a business with a 5,000 dollar LTV and unsustainable for one with a 600 dollar LTV, which is why industry averages make a poor yardstick.
What is customer acquisition cost with an example?
Customer acquisition cost is the total sales and marketing spend required to win one new customer. Example. An online business spends 40,000 dollars in a month across ads, tools, and the team running them, and acquires 100 new paying customers. Its fully loaded CAC is 400 dollars. If ad spend alone was 25,000 dollars, its platform CAC for the same month would be 250 dollars, which is why the definition always needs stating.